Waking up with a scratchy throat and watery eyes isn't just an annoyance-for millions of people, it's a daily battle that can ruin a weekend hike or a morning run. But what if you could predict exactly when the air is most dangerous? Pollen forecasting is a meteorological service that predicts the concentration of airborne pollen grains per cubic meter of air. It's not just about knowing if it's "pollen season"; it's about knowing if Tuesday at 10 AM is a disaster for your sinuses while Thursday evening is perfectly clear.
If you suffer from seasonal allergic rhinitis, you know the frustration of taking medication only to find it's not enough when the wind picks up. By using a forecast, you can actually reduce your symptom severity by up to 65%. The secret isn't just in the medicine, but in the timing of your life.
The Quick Guide to Pollen Levels
Before you check your app, you need to know what the numbers actually mean. Most services categorize pollen count based on the number of grains found in a cubic meter of air. While different plants have different triggers, the general scale looks like this:
| Level | Grains per Cubic Meter (m³) | Impact on Sufferers |
|---|---|---|
| Low | ≤50 | Minimal symptoms for most |
| Moderate | 51-149 | Noticeable symptoms for sensitive users |
| High | 150-499 | Significant respiratory distress |
| Very High | ≥500 | Severe reactions; high risk of asthma flare-ups |
Keep in mind that some allergens are more potent than others. For example, ragweed is far more aggressive; for that specific plant, a count of just 20 grains/m³ is already considered high. Always check which specific plant is peaking in your area before assuming a "moderate" day is safe.
Timing Your Day Around the Pollen Clock
Pollen doesn't just float around at a constant rate all day. It follows a very specific biological and meteorological rhythm. If you can sync your outdoor chores or workouts with these patterns, you'll breathe a lot easier.
- Tree Pollen: Usually peaks between 5 AM and 10 AM. This happens as the morning dew dries and the wind begins to pick up. If you're allergic to oak or birch, avoid early morning walks.
- Grass Pollen: Hits its peak during the middle of the day, typically from 10 AM to 4 PM. This is the danger zone for anyone who loves midday sports.
- Weed Pollen: These often peak in the late afternoon, between 4 PM and 8 PM.
If you need to get outside, the "golden windows" are generally very early morning (5-7 AM) or later in the evening (7-9 PM), when counts are often 30-50% lower than the daily peaks. For athletes, this is a game-changer. Research shows that marathon runners who shift their training to these early windows experience nearly 45% fewer respiratory symptoms.
How Weather Actually Changes Your Allergy Risk
You might notice that a breezy day feels worse, or that you suddenly feel better after a rainstorm. This isn't in your head; it's physics. Understanding the relationship between meteorology and allergens helps you fill the gaps in a basic forecast.
Rain is your best friend. A modest rainfall event (around 0.1 inch) can scrub the air, reducing pollen counts by 30-50% within just two hours. On the flip side, dry and windy conditions act like a giant fan for plants. High winds can increase pollen dispersal by 40%, pushing allergens from forests far into the city center.
Temperature also plays a role. Generally, for every 2-3°C increase in temperature, you can expect pollen counts to rise by 15-20%. This is why a sudden warm spell in early spring often triggers an immediate surge in symptoms.
Choosing the Right Forecasting Tool
Not all allergy apps are created equal. Some just tell you the general season, while others use machine learning to give you a hyperlocal view. Depending on how severe your allergies are, you'll want a different level of precision.
For most people, a general tracker like Pollen.com is enough to know when to buy more tissues. However, if you have severe asthma or a high sensitivity, you need hyperlocal resolution. Traditional monitoring stations provide a city-wide average, but pollen levels can actually vary by 300% between a leafy suburb and a concrete city center. Modern services like BreezoMeter use satellite imagery and land-use data to provide a resolution of 1.5km, which is far more accurate for planning a specific route for a run or a walk.
A pro tip from the community: don't rely on just one app. Cross-reference a high-tech API-based service with a local government weather report. If both agree that pollen is "Very High," stay inside.
Strategic Planning for Outdoor Activities
So, how do you actually put this into practice? It's about building a buffer between you and the allergens. Use this strategy to plan your week:
- The 72-Hour Outlook: Check your forecast three days out. If a "Very High" peak is predicted for Saturday, move your gardening or outdoor cleaning to Friday.
- The Rain Window: Look for precipitation in the forecast. Plan your high-effort outdoor activities (like mowing the lawn) for 2 to 4 hours after a rain shower.
- The Wind Check: If the wind is gusting over 10-15 mph and the forecast is already "Moderate," treat it as "High." The wind will likely stir up dormant pollen from the ground.
- The Symptom Log: Start a simple note on your phone. Record the pollen level of the day and how you felt. You might find that you're fine at 200 grains/m³ but crash at 300. This creates your own personal threshold.
For parents of children with allergies, these steps are even more critical. Many school districts are now adjusting outdoor recess schedules based on these forecasts to prevent asthma attacks during peak grass pollen hours in May and June.
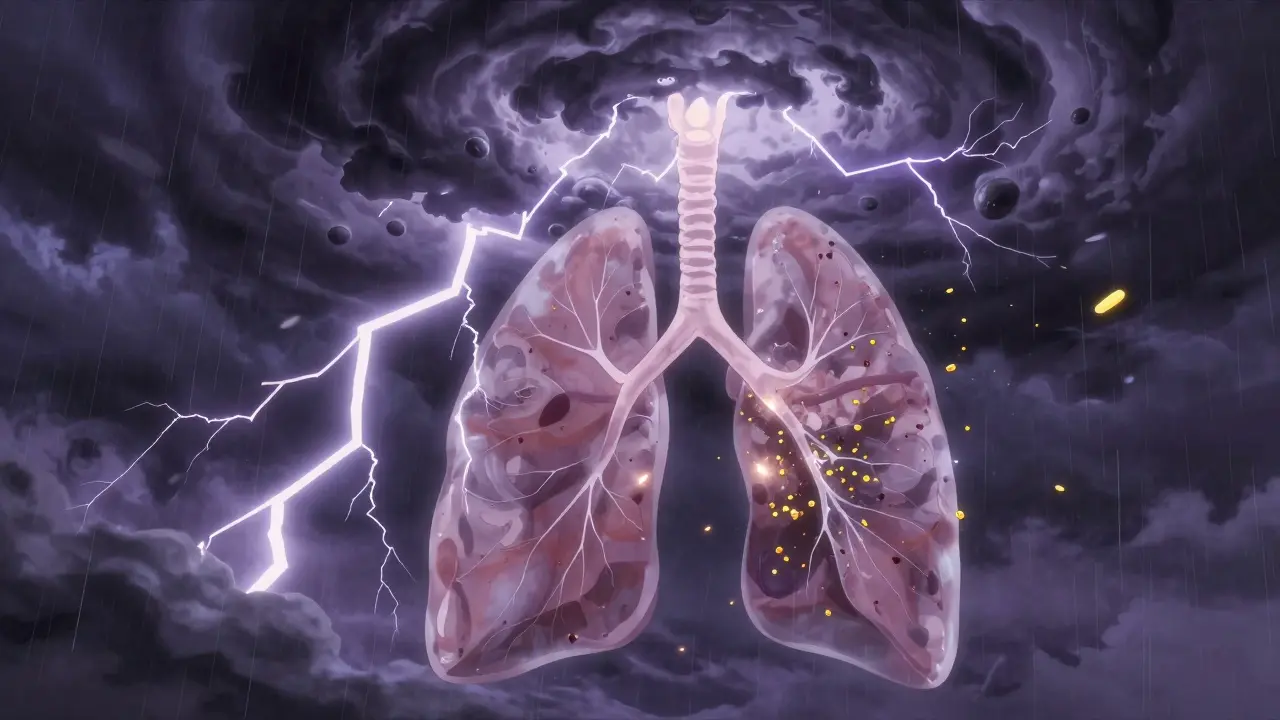
The Danger of "Thunderstorm Asthma"
There is one major limitation to every pollen forecast: the thunderstorm asthma event. This is a rare but dangerous phenomenon where a storm doesn't just wash pollen away-it actually breaks pollen grains into smaller particles that can travel deeper into the lungs. This can cause pollen counts to spike 300% in under 30 minutes.
If you live in a place like Melbourne and see a sudden, violent thunderstorm during high pollen season, be extremely cautious. Even if your app says "Moderate," the atmospheric instability can turn a manageable day into a medical emergency. In these moments, the forecast is less important than the immediate weather behavior.
Can I trust a 5-day pollen forecast?
Generally, yes, but with decreasing accuracy. While 24-hour forecasts are highly reliable (around 85% accuracy), a 72-hour forecast usually drops to about 65%. This is because pollen models depend entirely on weather forecasts; if the temperature prediction is off by just 2°C, the pollen count can be wrong by nearly 20%.
What is the best time of day to go outside during peak season?
The safest windows are typically early morning (5 AM to 7 AM) and late evening (7 PM to 9 PM). During these times, pollen concentrations are often 30-50% lower than their midday or early morning peaks, depending on whether tree, grass, or weed pollen is dominant.
Does rain always clear the air?
Most of the time, yes. A typical rainfall event reduces airborne pollen counts by 30-50% for about 2 to 4 hours. However, be wary of thunderstorms, which can occasionally rupture pollen grains and cause "thunderstorm asthma," actually increasing the risk for sensitive individuals.
Which pollen types are the hardest to forecast?
Weed pollen, particularly ragweed, is significantly harder to predict than tree or grass pollen. Only about 12% of current forecasting models are considered highly accurate for ragweed, meaning you should be extra cautious during late August and September.
How does a "rotorod" measure pollen?
A rotorod uses greased silicone rods that rotate in the air over a 24-hour period. The grease traps airborne pollen grains, which are then collected and counted under a microscope by specialists. This provides a very accurate local measurement, though it doesn't provide a future prediction.


Sue Stoller
April 22, 2026 AT 04:49This is such a helpful breakdown! 🌸 Definitely going to try shifting my morning walks to later in the evening. Let's all stay healthy and breathe easy! ✨😊
Rick Brewster
April 22, 2026 AT 06:04one must wonder if the very act of quantifying nature into grains per cubic meter is simply a symptom of our desperate need to control the organic chaos of existence but then again the biological imperative to avoid respiratory failure is a fairly strong motivator regardless of the ontological implications of the measurement itself no matter how flawed our tools are
Emma Cozad
April 23, 2026 AT 20:04pollen forecasts r basically just a way for the gov to tell us when to stay inside so they can spray more chemicals on the grass without us seeing. total scam lol
Sarah Watters
April 24, 2026 AT 14:15Funny how these "forecasts" always seem to align with when the new medication batches are released into the market. It is all just a coordinated effort to keep us dependent on pharmaceuticals while they monitor our movements using these so-called hyperlocal apps. The data isn't for our health; it is for their mapping.
Chidi Prosper
April 25, 2026 AT 08:34The point about rain scrubbing the air is spot on. I've noticed the air feels significantly lighter after a storm, and it's a relief to see the science backing that up. It makes planning much more intuitive.
vimal purwal
April 26, 2026 AT 11:10I must express my complete agreement with the utility of maintaining a personal symptom log, as it empowers the individual to move beyond generic data and enter a realm of personalized health management that is far more effective than any general app could ever provide, especially for those of us who have navigated these sensitivities for decades in varying climates.
Divyanshu Giri
April 26, 2026 AT 12:49absolute gold info right here keep crushing it with these tips my lungs feel like they are dancing already
Mel Glick
April 27, 2026 AT 18:48I'm totally on board with the hyperlocal approach! People who think a city-wide average is enough are just kidding themselves. You can literally walk one block into a park and be in a different pollen zone. Get the precise apps or just deal with the sneezing, it's a choice!
Ally Warren
April 28, 2026 AT 23:28The concept of 'Thunderstorm Asthma' is a fascinating intersection of meteorology and pathology. It reminds us that our perceived safety in a rain shower is often an illusion, as the environment can transform a benign allergen into a weapon through simple atmospheric instability.
Nicole Antunes
April 30, 2026 AT 14:03It is quite reasonable to advise the use of multiple apps for cross-referencing. :)
Anantha Lakshmi
May 1, 2026 AT 01:59Let's all try to be more mindful of our kids' schedules during those May peaks! 🏃♂️💪 We can definitely make a difference in their school day by sharing this info with teachers! 🌟
Saptatshi Biswas
May 3, 2026 AT 00:10The absolute audacity of suggesting that a general tracker is "enough" for most people is staggering. In India, our environmental pollutants combined with pollen create a toxic slurry that no basic app could possibly quantify. You are analyzing this from a sheltered, Western perspective that ignores the systemic atmospheric failures in the global south.
It is frankly insulting that you assume a "leafy suburb" is the only variable when we have industrial smog interacting with biological allergens in ways your precious 1.5km resolution likely ignores entirely.
The precision you boast about is a joke compared to the actual chaos of an urban monsoon season.
Your data is sanitized.
Your conclusions are reductive.
The arrogance of presenting this as a universal guide is typical of this kind of surface-level analysis.
You've completely missed the interplay between humidity and pollen rupture in tropical climates.
It's a failure of research.
A complete oversight.
The methodology is flawed.
The scope is too narrow.
It's practically useless for anyone outside a temperate zone.
I find the lack of global context offensive.
Stop pretending these rules apply everywhere.
It's a joke.